


Products
Solutions
Resources
Company
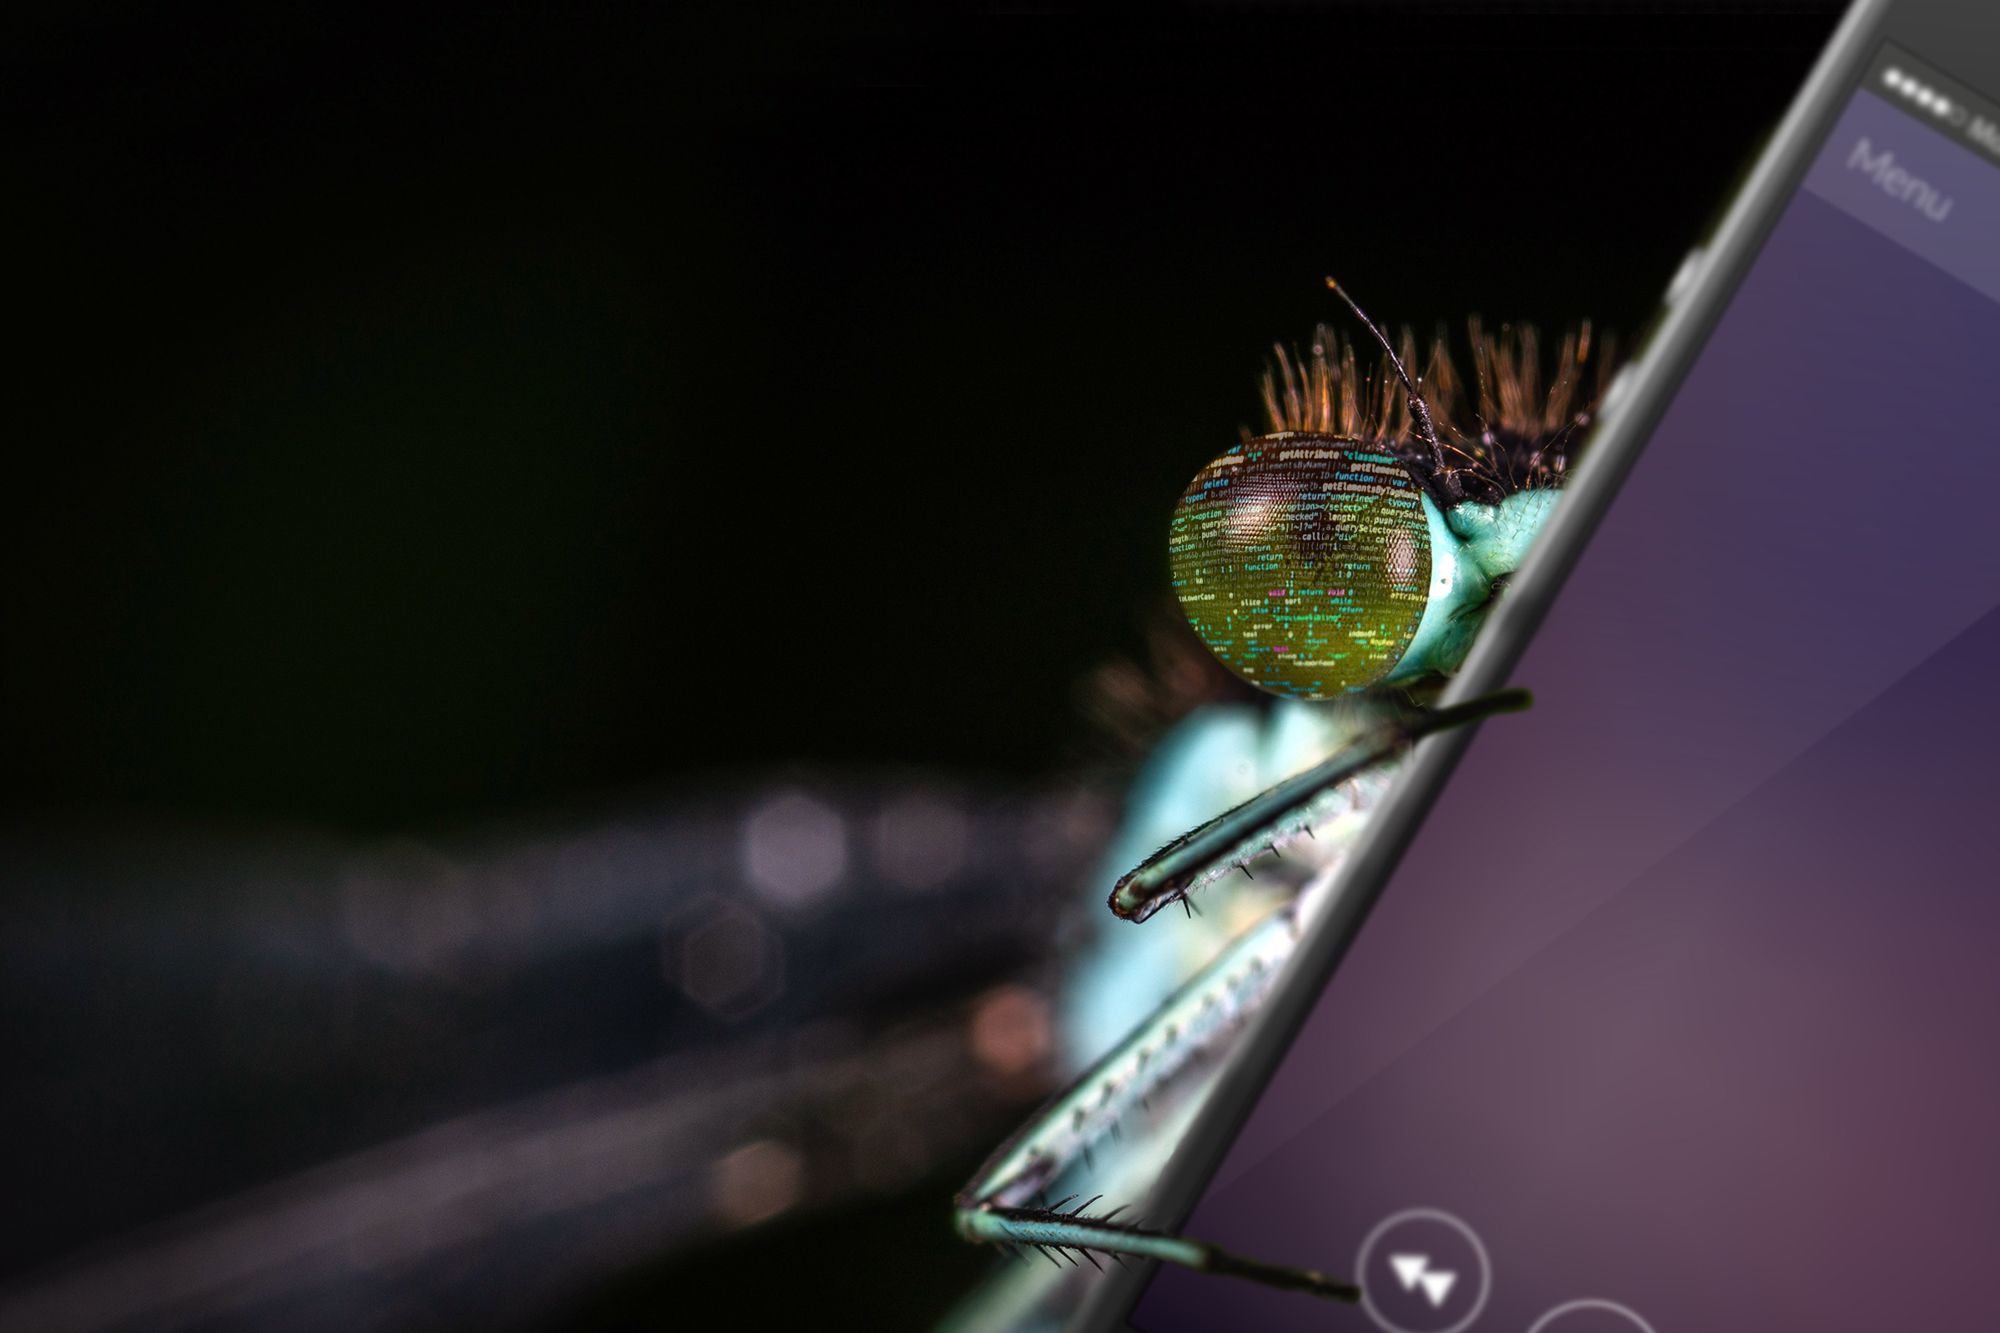
Dealing with crashes is a part of any type of software development. In this day and age, so is making sure your source code remains uncompromised. Obfuscation is the foundation of any well-protected app and its code, however it may come at a price. Notably, obfuscation makes gaining insight into your app difficult for malicious third-parties and developers alike. With it, it's just as much a hassle for hackers to get access to your app code as it is for a developer to find out what causes a given crash. That is unless he/she uses DexGuard.
Thanks to its very own built-in tool, supported by most crash analysis frameworks, mobile app protection software DexGuard enables app developers to understand what happens inside their obfuscated applications so that they can troubleshoot accordingly.
Normally, when something goes wrong in an Android app, the error is posted on the internal log of the smartphone. You can read this log using the adb logcat command (Android Debug Bridge is shipped with any Android Studio download):
$ adb logcat
(...)
Caused by: java.lang.RuntimeException: This is a crash
   at o.ᕑ.ˎ(:7)
   at o.ᔊ.ˎ(:6)
   at o.ᐢ.ˋ(:11)
   at com.example.HelloWorldActivity.onCreate(:42)
   ... 13 more
Crash information usually contains a type of Exception, a short description of what caused the crash, and a stack trace that indicates exactly where the crash occurred during the app execution. However, as you can see, the stack trace above is heavily obfuscated due to the use of DexGuard. Once again, this is great for hiding valuable app information from potential attackers but, as a developer, you need some way to see what went wrong in order to fix the issue.
During the build process, DexGuard stores mapping information about obfuscated classes in a file. This mapping file is written out in a separate directory from your APK and used to make obfuscated stack traces readable to the developer again, thanks to DexGuard’s ReTrace tool. All you need to do is run the following command on your machine locally:
$ java -jar path/to/retrace.jar mapping.txt obfuscated_stacktrace.txtwhere:
retrace.jar can be found in your DexGuard download
mapping.txt is located in your applications mapping directory (by default build/outputs/mapping)
obfuscated_stacktrace.txt is a text file that contains your error stack trace as you find it with adb logcat (as described above).
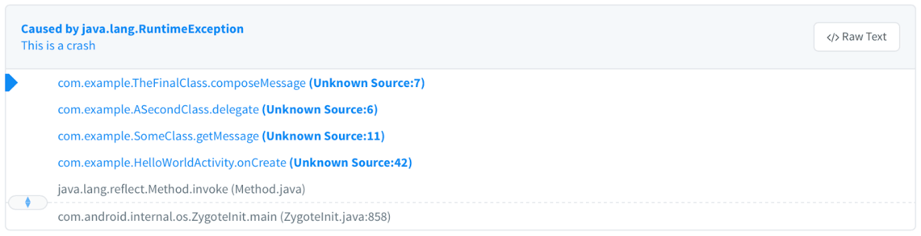
Applying the command above to the obfuscated stack trace will result in the following clean output:
Caused by: java.lang.RuntimeException: This is a crash
   at com.example.TheFinalClass.composeMessage(TheFinalClass.java:7)
   at com.example.ASecondClass.delegate(ASecondClass.java:6)
   at com.example.SomeClass.getMessage(SomeClass.java:11)
   at com.example.HelloWorldActivity.onCreate(HelloWorldActivity.java:42)
   ... 13 more
Most crash analysis frameworks (e.g. Bugsnag, Crashlytics etc.) also have built-in support for such mapping files. Crashlytics, for example, automatically picks up the mapping file while your app is building. No extra configuration or action is required to produce the DexGuard deobfuscated strack trace in the Crashlytics dashboard. Below is the output for the stack trace mentioned above:
Bottom line, no matter what your debugging workflow is, obfuscation will not block your access into your app’s innerworkings when using DexGuard (and/or ProGuard) integrated with any popular online crash analysis framework.
