


Products
Solutions
Resources
Company
When you try to learn what unknown programs do, you will usually employ several different analysis methods to get new insights into its workings step by step. One of the fundamental steps needed to know how a program behaves is reconstructing its control flow.
Control flow can be divided into two parts. On the one hand, we have intraprocedural control flow, showing us what exactly happens inside a specific method. And on the other hand there is interprocedural control flow, which explains how a program jumps between different methods.
In this post, we will take a detailed look at call graphs in the context of ProGuardCORE, a library developed by Guardsquare, that offers versatile APIs to more effectively reason about different types of JVM programs, from classical desktop Java programs to Android apps written in Kotlin and everything in between.
Interprocedural control flow is modeled using a call graph in order to visually represent the flow between methods. In Figure 1 we can already see an example: the nodes of the graph represent a program’s methods, while an edge indicates that one method calls another method. You can see this relationship in both the code snippets and the graph by matching colors (e.g. the edge frommaintocalculateis created because of thecalculate()call in the first line ofmain).
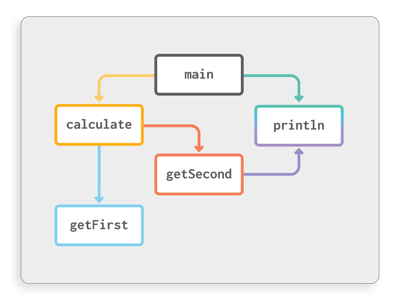
Figure 1: Relationship between code and call graph
void main()
{
    int x = calculate();
    System.out.println(x);
}

int calculate()
{
    int a = getFirst();
    int b = getSecond();
    return a + b;
}

int getFirst()
{
    return 12;
}

int getSecond()
{
    System.out.println("second");
    return 30;
}
Such a graph illustrates how different methods in the program are connected, such as showing what parts of third party libraries are actually used. This paves the way for smart optimizations, like removing unneeded code from your program (arguably the single most important optimization leveraged by compilers). More advanced analyses and optimizations, like reconstructing how data flows through the program, also depend on having call graph information.
The reason why we need call graph information is that without knowing about interprocedural control flow, any analysis would be confined to the scope of single methods. For dataflow analysis, this would mean that flows going through multiple methods would not be found, which drastically reduces the overall accuracy and usability.
ProGuardCORE offers you different ways of accessing and navigating the resulting call graph to any level of detail you like. We will explore the most important APIs step by step in the following sections. The following call graph will be used as example throughout each step:
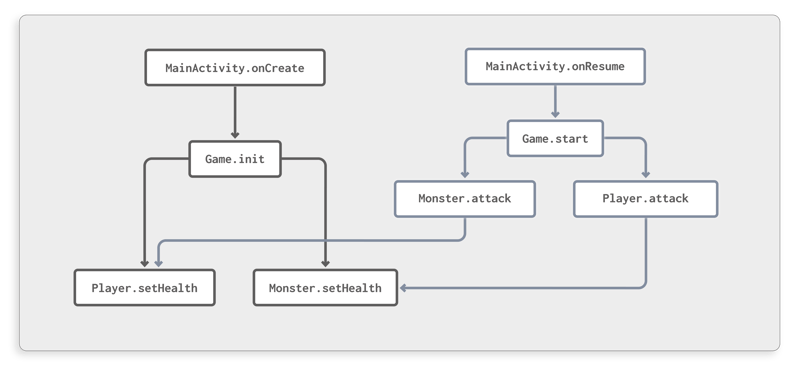 Figure 2: Call graph of a simple game
This graph represents a simple Android game featuring a player and a monster object that fight against each other. The game is controlled by the Android activity lifecycle, initializing inonCreateand starting inonResume.
Before we can explore a call graph, we first need to construct it. This requires us to know which instructions in a program are method calls, and their target method. This process is performed by ProGuardCORE’sCallResolver. If you are interested in more details about this call resolution process, check out our related blog post.
While this component is doing its work, it can do more than just add all found calls to the call graph. It also provides a convenience API to trigger a callback for each newly discovered call. To use it, simply register aCallVisitorimplementation through theCallResolver.Builderas shown in the following code snippet:
CallGraph callGraph = new CallGraph();
CallResolver resolver = new CallResolver.Builder(programClassPool,
libraryClassPool,
callGraph,
call ->
{
// Callback for each call that is found
System.out.println("New call from "
+ call.caller
+ " to "
+ call.getTarget());
}).build();
programClassPool.classesAccept(resolver);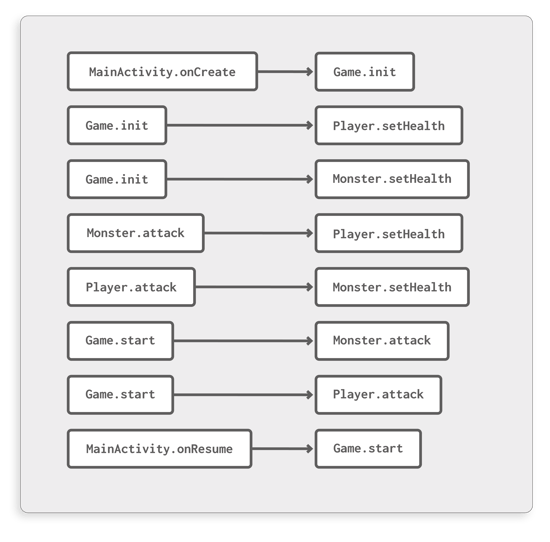 Figure 3: Individual calls contained in the program
EachCallobject contains information about the location of the caller, the target method and even reconstructed argument and return values. This is actually information that would only be fully known during runtime, but with ProGuardCORE’sPartialEvaluator, we can also deduce this statically in many cases. Worth noting, however is that sometimes this is impossible, such as in the following snippet:
public void greet(String name)
{
    // The value of "name" is unknown before actually running the program
    System.out.println("Hello " + name);
}
Once theCallResolveris done, it will have filled aCallGraphobject. This provides the following data that enables you to quickly see which methods are direct neighbors in the call graph:
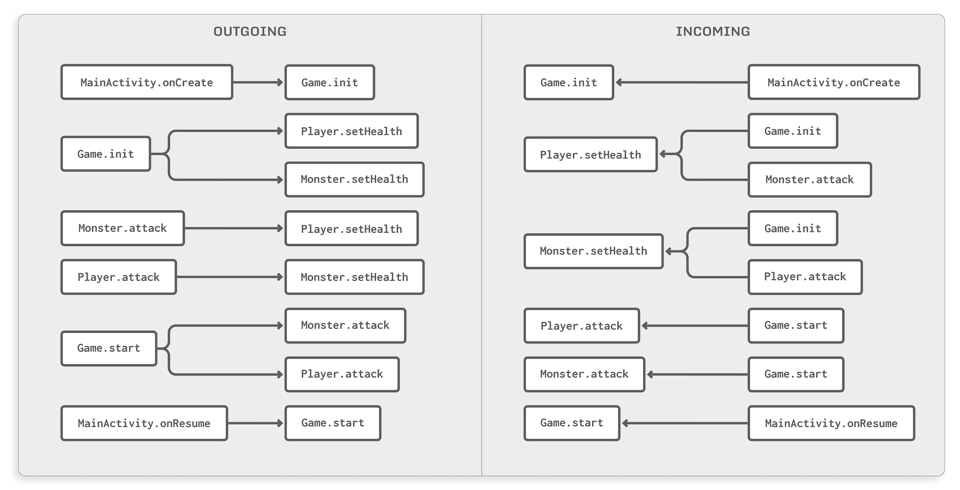
Figure 4: The outgoing and incoming maps of the call graph
By default you won’t be able to see argument values here as you could in thevisitCallcallback. This is a memory optimization, as keeping all argument and return values around would result in a tremendously high memory consumption for larger programs. If you would like to retain this information even in the full graph, you can switch off this optimization through theCallResolver.Builder#setClearCallValuesAfterVisitmethod.
Direct neighbors of a method in the call graph are not the only points of interest when analyzing programs. For many complex analyses, you are also interested in transitively reachable methods.
Take a look at Figure 5, for example. This models a scenario where we are trying to find out which methods can somehow be triggered whenMainActivityis initialized through itsonCreatemethod.
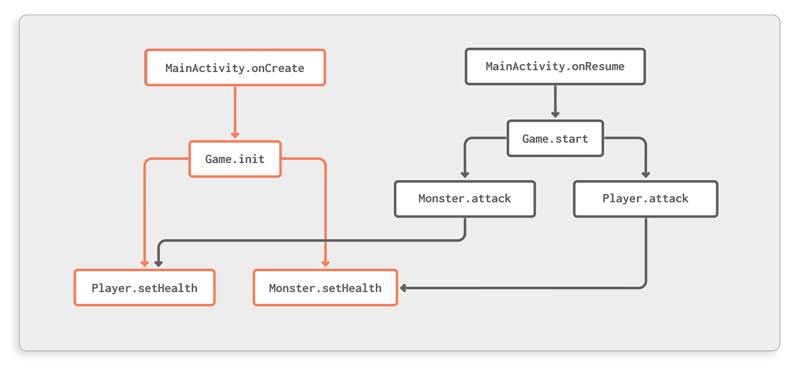
Figure 5: Transitively reachable methods fromMainActivity.onCreate
ProGuardCORE allows you to perform such queries as follows:CallgraphWalker.getSuccessorsgives you a set of methods that some starting point can reach through outgoing edges, whileCallgraphWalker.getPredecessorsproduces the inverse result, returning all methods that can reach your target method.
For our example, it would look like this:
MethodSignature start = new MethodSignature("MainActivity",
                                            "onCreate",
                                            "(Landroid/os/Bundle;)V");
Set<MethodSignature> successors = CallGraphWalker.getSuccessors(callGraph, start);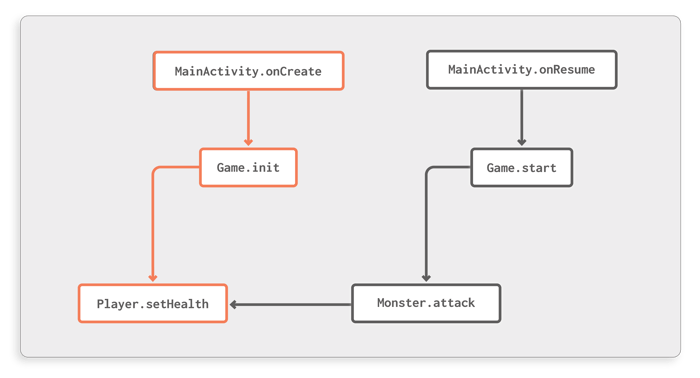
Figure 6: Incoming call graph forPlayer.setHealth
Especially when analyzing Android apps, theCallGraph.reconstructCallGraphAPI can be useful; it reconstructs a subgraph of the call graph that contains all incoming paths to a specific method, starting at methods that either have no incoming methods themselves or are known to be Android lifecycle entry points (like any activity’sonCreatemethod).
Let’s assume, for example, that you are interested in the incoming call graph forPlayer.setHealth. This can be constructed using the following code:
MethodSignature start = new MethodSignature("Player",
                                            "setHealth",
                                            "(I)V");
Node result = callGraph.reconstructCallGraph(programClassPool, start);Theresultobject is aNodewhose connections can be visualized as shown in Figure 6. Such a subgraph gives you a good overview of howPlayer.setHealthis connected to the rest of the app.
Another version of this API also conveniently collects all Android lifecycle entry points that trigger this method. In our example, this would beMainActivity.onCreateandMainActivity.onResume.
The queries shown above only scratch the surface of how you might want to explore call graphs. Because of the flexibility required to support all kinds of analyses, ProGuardCORE offers a generic framework that you can use to conveniently navigate the call graph. In fact, all APIs shown before use this framework under the hood.
CallgraphWalker.successorPathsAcceptexplores the call graph through outgoing edges, starting at a specific start method. You can piggyback your analysis onto that exploration process by providing a handler function that receives the currentNodeof the exploration (current method and all previously visited methods on that specific path). This handler can then control the exploration; if it returnsfalseat any point in time, this current path is no longer explored further. This is, for instance, used when calculating the incoming call graph, where the handler function returnsfalseas soon as a known Android entry point is identified in the current path.
Analogously,CallgraphWalker.predecessorPathsAcceptexplores the graph in the opposite direction, again accepting a handler function to perform custom analyses on the fly.
Being able to model the interprocedural control flow as a call graph is one of the most important building blocks when analyzing programs. Many of the more advanced analyses depend on this information being available. In this post, we looked at the APIs ProGuardCORE provides for this purpose, so that you can start building your own analysis pipeline on top of this functionality.
ProGuardCORE also offers additional features for narrowing down the number of potential call targets, such as providing information about whether individual calls are surely going to be executed at runtime or if there is some degree of uncertainty involved. This uncertainty might come from the fact that the call is only executed if some if condition evaluates totrue, or that the called object may have one of several types, where the actually called method can only be decided at runtime.
We are looking forward to seeing what kind of interesting projects you will build using ProGuardCORE’s extensive analysis suite, ranging from simple JVM class structure modeling over call graph exploration to sophisticated analyses like partial evaluation or dataflow analysis.
Feel free to suggest improvements or even create a pull request yourself, we would love to incorporate your contributions on GitHub.
