


Products
Solutions
Resources
Company
Mobile application protection is an important part of the process when it comes to mobile app development today. But the implementation is not as simple as just increasing security checks. This is because vendors and protection technologies that protect mobile apps can often prohibit the processes of building, testing, and debugging applications. After all, we know mobile applications have bugs; no developer can create an error-free app.
Developers need to select vendors and protection technologies that protect mobile apps without creating new headaches associated with efforts to debug protected mobile applications. But this can be more challenging than many developers realize.
In the process of protecting an application, the application code is transformed to prevent reverse-engineering and tampering. Functions are broken apart, the flow of the code is changed, and numerous anti-tampering checks are added. This is exactly the goal of the protection.
However, diagnosing and locating defects becomes progressively more difficult.
For example:
It is important to identify the source and the reason for an application's unexpected behavior, both during in-house debugging and production use.
For protected applications, there are two additional challenges for security vendors:
iXGuard produces debug symbols containing information about:
With iXGuard 4.3, the existing application debug information is augmented with extra data about:
This data allows developers to have greater insight into the workings of their protected application than ever before. Additionally, all the debug information is placed in debug symbol (.dSYM) files that are not distributed to end users. This ensures no security impact on the final product.
The sections below illustrate the user experience with iXGuard 4.3 in various diagnostics tools.
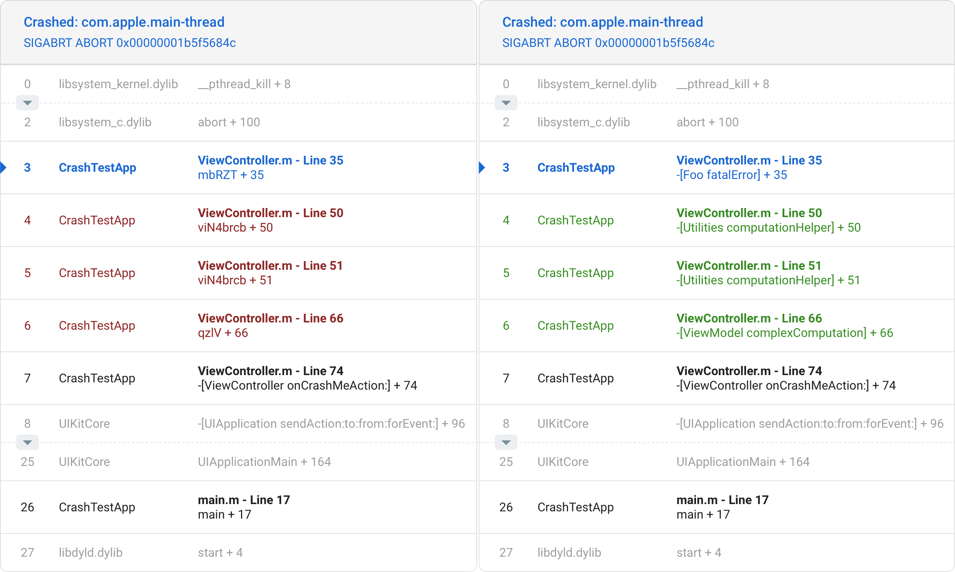
The new information available in debuggers clearly indicates RASP. This leaves no doubt on the reason for the application exit.
Before:
Thread 0 Crashed:: Dispatch queue: com.apple.main-thread
0 obf_4.2 0x000000010bb21e65 0x10bb1e000 + 15973
1 obf_4.2 0x000000010bb21dc7 iR3i5 + 23 (foo.m:18)
2 obf_4.2 0x000000010bb21ed4 0x10bb1e000 + 16084
3 libdispatch.dylib 0x00007fff2044d7c7 _dispatch_client_callout + 8
4 libdispatch.dylib 0x00007fff20450195 _dispatch_continuation_pop + 423Thread 0 Crashed:: Dispatch queue: com.apple.main-thread
0 obf 0x000000010a32ae65 ixguard.jailbreak.exit - Jailbreak Detection exit + 7 (foo.m:1) [inlined]
1 obf 0x000000010a32ae65 jb_checkpoint + 149 (foo.m:1)
2 obf 0x000000010a32adc7 -[Foo lowerMe] + 23 (foo.m:18)
3 obf 0x000000010a32aed4 ixguard.objc_calls - Protected Objective-C call to -[Foo lowerMe] + 8 (foo.m:33) [inlined]
4 obf 0x000000010a32aed4 __main_block_invoke + 36 (foo.m:33)
5 libdispatch.dylib 0x00007fff2044d7c7 _dispatch_client_callout + 8
6 libdispatch.dylib 0x00007fff20450195 _dispatch_continuation_pop + 423Performance profilers help to clearly display the performance impact of the RASP-enabling developers. This allows them to quickly take action to tune the protection and mitigate the impact.
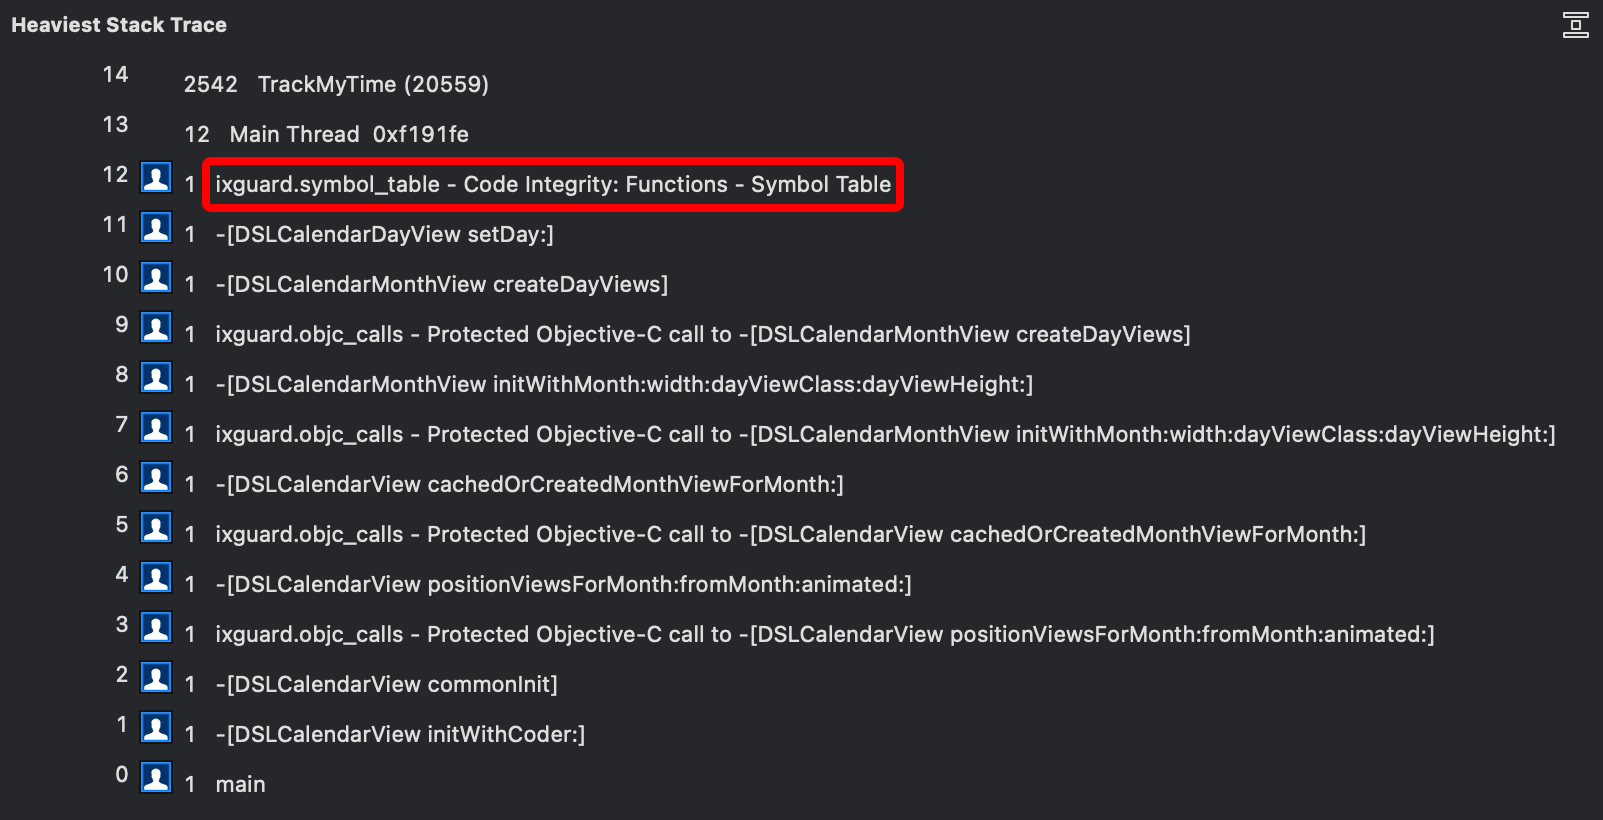
Crash reporting tools display extended information about the source and the context of an application crash.
The expectations placed on developers to provide a secure and fully functioning mobile app continue to grow. It requires a thoughtful approach to enhancing effort around mobile app security, including carefully identifying and selecting the vendors you choose to work with.
iXGuard not only protects your app, but also supports your continuous quality improvement process by providing all the necessary information to detect issues and take action.