


Products
Solutions
Resources
Company

Compiler-based protection is the most effective way to secure a mobile application. Because it weaves defenses directly into the app’s logic, it is more difficult for attackers to bypass or strip the protection away. But keeping an app secure is only half the battle. A crucial requirement for any security mechanism is maintaining optimal performance and ensuring a seamless user experience.
Achieving this requires a deep understanding of runtime behavior. While spotting a performance drop is usually straightforward, investigating the actual root cause can be quite challenging. Building a polymorphic Android app protection engine like DexGuard has provided us a lot of valuable insights into analyzing runtime behavior in such environments. Profiling and debugging a prebuilt APK is a hurdle on its own, as standard debugging tools rely heavily on having the source code available. Additionally, factors such as invisible overhead across the JNI boundary and optimizations performed by the Android Runtime (ART) can make it even harder to pinpoint where time is actually being spent.
In this post, we will start with surface-level tools and progressively dive into the more difficult, unconventional techniques we’ve used to investigate performance bottlenecks deep within the compiled application. These lessons can be useful for anyone working in similar conditions, whether you are profiling third-party dependencies, reverse engineering, or manipulating bytecode.
Tracking app startup time is a common practice for monitoring app performance. We rely on this exact metric, among others, to ensure our protections do not degrade the user experience. When a slowdown does occur, discovering the root cause usually starts with a standard Java/Kotlin profiler (like the one in Android Studio).
However, analyzing a prebuilt app presents two unique hurdles:
Tip: Making a Build Profileable
To overcome the second hurdle, you can unpack the APK with apktool, add <profileable android:shell="true"/> inside the <application> tag in the AndroidManifest.xml, and repack the APK.
This is preferred over making the app debuggable, which introduces significant performance penalties that can taint your test results. Note, however, that profileable is not available on older API levels, in which case you can instead add android:debuggable="true" to the <application> tag in the manifest.
Once the app is profileable, you can then capture the trace. While Android Studio does enable profiling a prebuilt APK, the process is quite cumbersome. It requires creating and configuring a new project for every APK, waiting for Smali indexing, and working with trace files that can become quite large (often several gigabytes).
Instead, we highly prefer profiling by running Perfetto, Android's default profiler, directly via ADB. This bypasses the IDE entirely and generates much smaller trace files (typically in the 10MB range) while retaining all necessary information for our use cases.
When starting the profiler via ADB, we recommend performing method sampling.
Always start with method sampling. You can increase the sampling frequency to get a more granular view of the app's execution. Full method tracing is rarely useful for profiling the app as a whole due to buffer overflow, so reserve it strictly for profiling specific, isolated functions (for example, by wrapping the code block in Trace.beginSection()).
To capture a profiling trace via ADB:
1. Start capturing a trace. For method sampling with an interval of 1000 µs, use:
2. Stop the capture once the app has started up or you are done performing the slow action:
3. Pull the trace file from the device to your machine:
Note: If the generated trace file is empty (0 bytes), double-check that the app is actually profileable or debuggable. Perfetto will not warn you in that case and it will fail silently.
To view the exported trace, we use the modern web UI at https://ui.perfetto.dev. If you are working with an optimized or obfuscated app, you can also use the Python script from Appendix A along with an R8/ProGuard mapping file to deobfuscate the trace file and more easily make sense of the information.
By applying these steps, you can perform an initial triage to locate the slowdown, and often identify the exact problem immediately.
Example: Spotting slow API calls in a profiling trace
(Note: Some specific details in the following example have been omitted or simplified for illustrative purposes.)
We captured a trace (method sampling with a 500 µs interval) for an obfuscated APK that was unexpectedly slow at launch. When we opened it in Perfetto, the root cause stood out immediately:
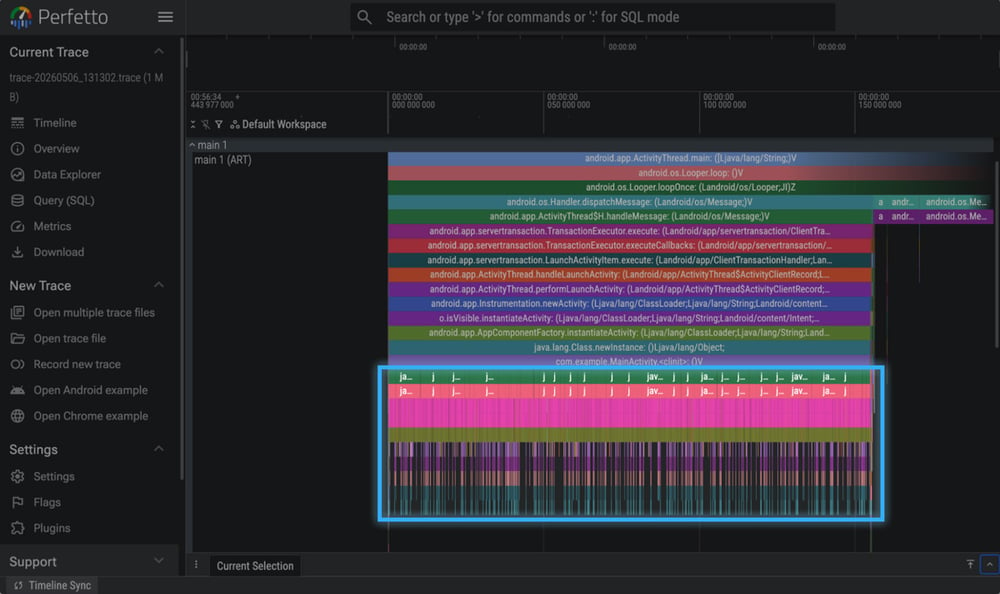
The MainActivity.<clinit> was taking a long time, and it was filled with a repeating pattern. The original app logic here was a simple byte-by-byte checksum calculation. However, to prevent attackers from lifting the code, our protection engine had automatically added an environmental check tied to the checksum calculation, such as NetworkInterface.getNetworkInterfaces() inside this loop.
By using Perfetto's selection tool to create a pivot table, we could also easily quantify the impact: (Note: Due to method sampling, not all numbers are exact or will perfectly add up.)
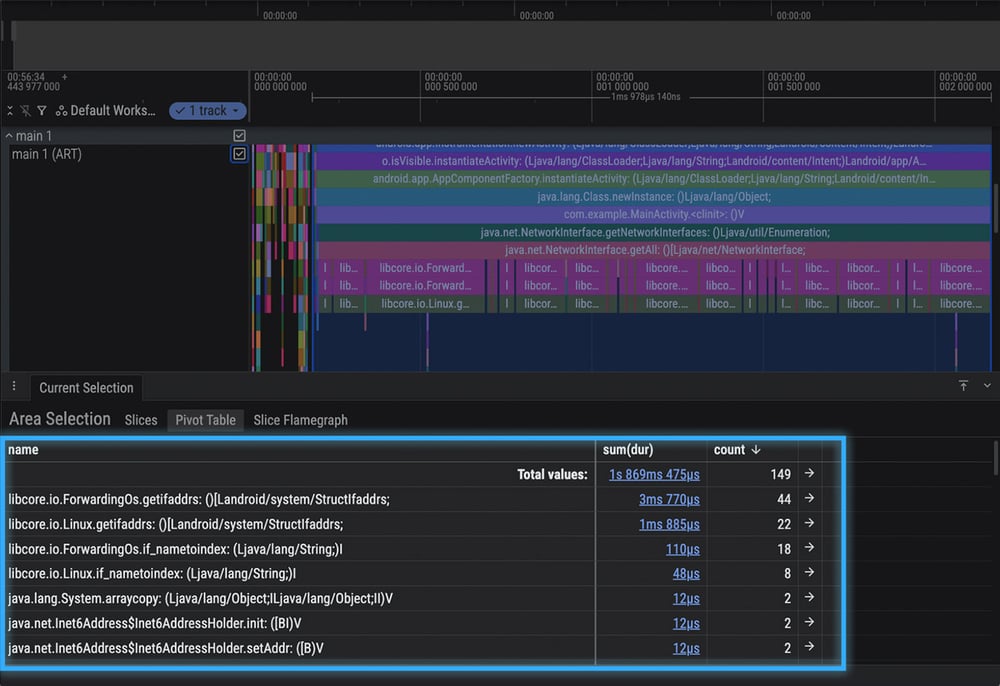
While this is usually a seamless defense, the trace revealed that on this specific device, the injected OS call took disproportionately longer to execute, leading us to adjust our engine's heuristics.
Often, a performance bottleneck doesn't live in Java or Kotlin code, but hides behind the Java Native Interface (JNI). While standard Java profilers easily reveal if you are crossing the JNI boundary too frequently (which is inherently expensive), they treat the native execution itself as a complete blind spot.
Example: Slow JNI call in a profiling trace
This is exactly what we encountered during a recent investigation. The Java profiling trace we captured simply showed a massive black box: a native method taking an unusually long time to execute.
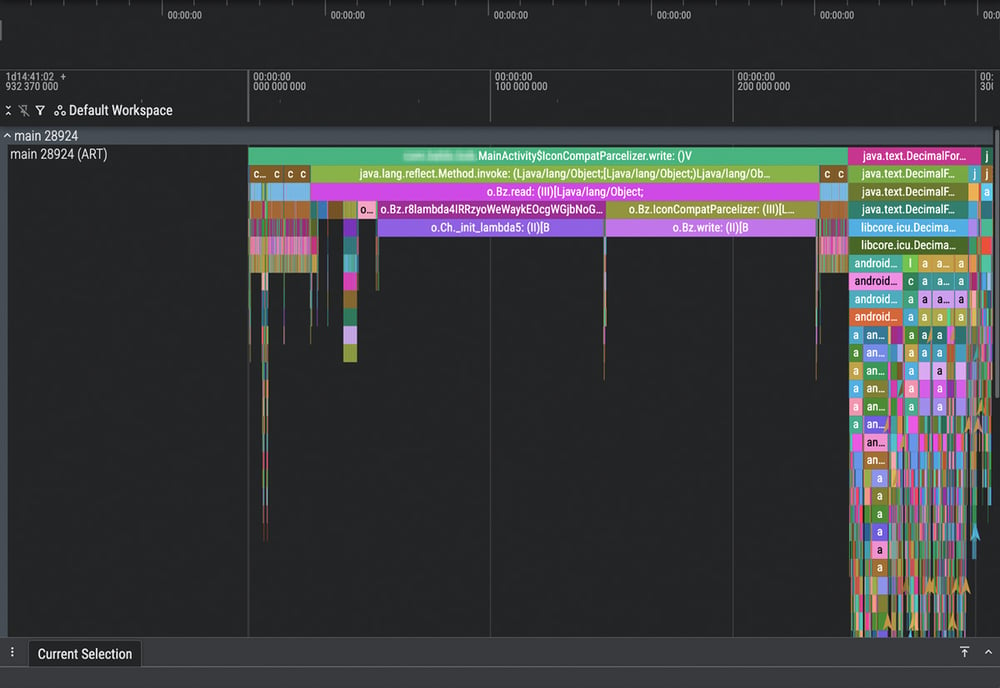
The trace above shows two obfuscated native methods, o.Ch._init_lambda5 and o.Bz.write, consuming significant time, but it provides no visibility into what the C code is actually doing.
If your slowdown is hidden within one of these native black boxes, you need to trace raw CPU cycles. For that, we use simpleperf, a powerful profiling tool included in the Android NDK. simpleperf provides flamegraphs and execution traces just like a Java profiler, but it specifically details the native C/C++ methods executed by the app, alongside lower-level system calls (syscalls).
The steps to capture a native trace and generate a report are:
1. Record the trace. Run the app using the command below and interact with it for a set duration (e.g., 10 seconds) to generate a perf.data file:
2. Link the debug symbols. If the native library inside the APK had its symbols stripped (which is standard for release builds), update the perf.data file to pull symbol names from your local, non-stripped build:
3. Generate the report. This creates an interactive HTML report containing the flamegraphs and charts, which you can open directly in your browser. Pass in your ProGuard/R8 mapping file so the Java-to-native calls are more readable:
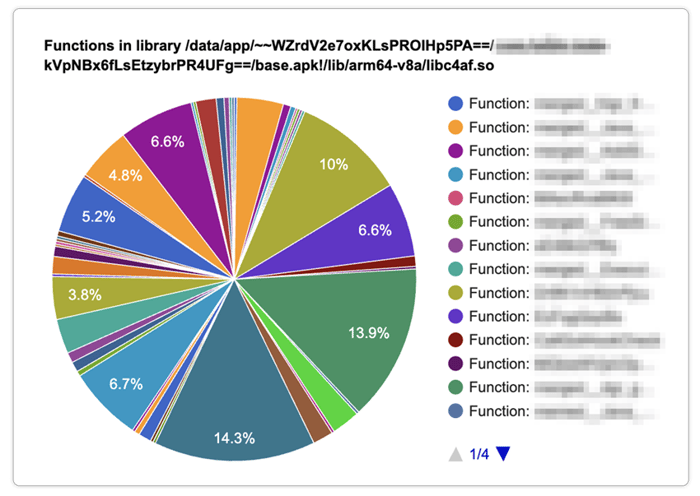
Once generated, the interactive HTML report provides a high-level overview of where CPU time is being spent across the entire process. It includes interactive pie charts that break down execution time by thread, library, and individual function. Additionally, the report generates native flamegraphs, which offer another intuitive view of the call stack (we will look closer at these in the next section).
Example: Finding native hotspots with Simpleperf
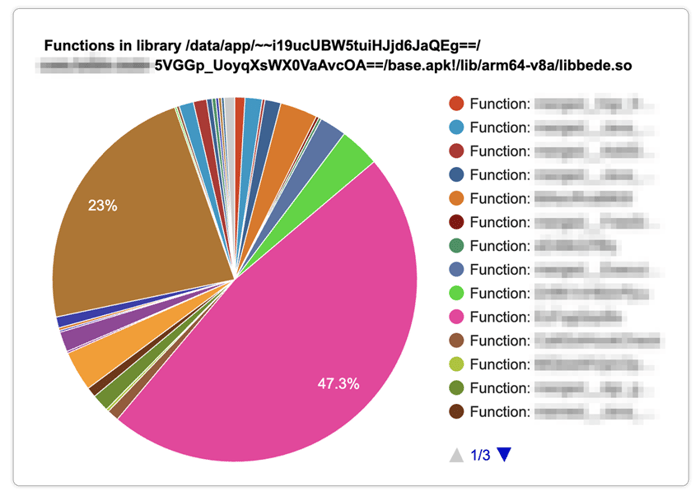
To see this in action, we can look at the generated HTML report from our investigation. By interacting with the chart, we drilled down into specific threads to see the cumulative execution duration of all native libraries. In our case, we were specifically interested in the obfuscated librarylibbede.sosince that is where the slow method was.
Going further into the specific functions inside libbede.so and looking at the function breakdown, we discovered the root cause: a highly obfuscated function that was called frequently across the native code (the pink slice in the image below) was causing the slowdown.
Identifying this allowed us to tune the protection configuration, and we could confirm that the execution time after was much more naturally distributed across the library:
Consider this scenario: you confirm via a Java profiling trace that a specific method is the root cause of a slowdown. However, the method is only slow on the very first app launch after installation, and mysteriously becomes fast on subsequent runs.
Sometimes, a performance drop isn't due to the code itself, but rather how the Android Runtime (ART) interprets and optimizes it. To understand why this happens, we first need to understand the different ways ART executes code throughout an app's lifecycle.
When a user launches an app, the runtime relies on three primary mechanisms to execute your code:
dex2oat): Over time, the execution data gathered by the JIT compiler is saved as Profiles. When the device is idle (or during app installation), the Ahead-Of-Time (AOT) compiler uses these profiles to pre-compile methods or entire classes into native machine code. This optimized native code is stored as .odex files in the private app directory under /data/app/<package.name>*/oat/. (You can read more about this in the official Android JIT architecture documentation).This lifecycle is illustrated in the diagram below:
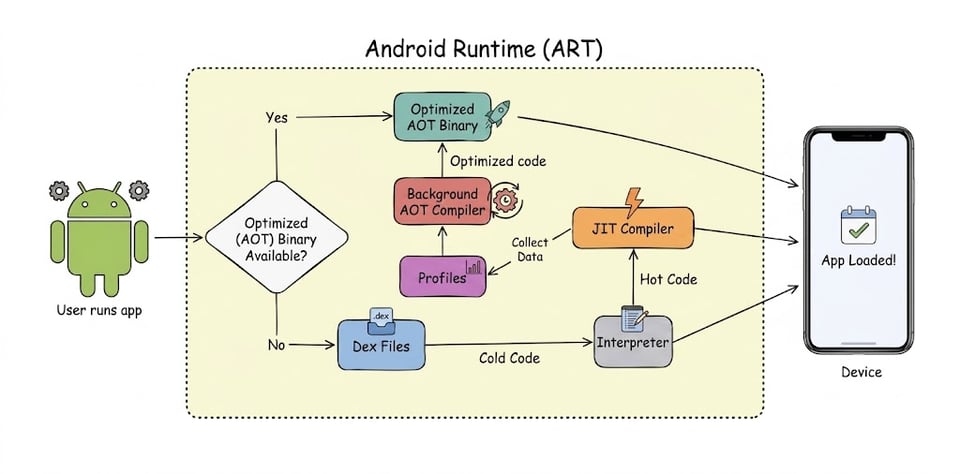
Essentially, when a user launches an app, the runtime first checks if an AOT binary is available. If it is, it executes the optimized native code directly. If not, it falls back to the raw .dex files and the slow interpreter.
Now that you know how AOT compilation works, we can return to our initial scenario. If a specific method is unexpectedly slow on the first launch but fast on subsequent runs, it means the AOT compiler likely skipped pre-compiling that method during installation. This forces the app to rely on the slow interpreter on that initial launch, until the JIT compiler eventually catches up and optimizes it for future runs.
To prove this is exactly what is happening under the hood, and to see how the code performs when fully optimized, we can manually take control of the compiler.
Tip: Inspecting compiled .odex files with oatdump
You can see the optimized (native) code that dex2oat outputs by running oatdump: (Note: requires a rooted device)
To illustrate what the output looks like: for example, this method was not compiled and falls back to the interpreter:
While this method was compiled; notice how code_offset points to a real memory address, and the CODE: block contains a hex dump of native machine instructions:
A great first triage step to confirm an AOT fallback is to force ART to pre-compile the app using different dex2oat compilation filters. We trigger this right after installation, but before running the app for the first time, using the following ADB command:
The most important compilation filters are:
verify Performs zero Ahead-Of-Time (AOT) compilation. This acts as your baseline by forcing the app to rely entirely on the slow interpreter and JIT.speed-profile Compiles only the methods listed in the app's Baseline Profile (this is used by default when the app is installed).speed Compiles most of the app into native machine code while considering storage space.everything Compiles the entire app into native machine code, regardless of storage concerns.You can verify that dex2oat successfully ran by checking logcat for the compilation filter:
A useful experiment is to compile the app with the everything profile. If the slowdown completely disappears, you have found a massive clue: the code runs fine when natively compiled, but standard installations (which use speed-profile) are skipping it. Since compiling everything is not viable for real-world end users due to storage constraints, we need to ensure the specific classes we need are compiled. This is where Baseline Profiles come in.
Tip: Measuring App Startup Time via ADB
To measure the actual impact of these different filters, you can launch your app via ADB with the -W flag. This forces the console to wait for the app to finish launching and prints the exact startup time:
Baseline Profiles explicitly tell dex2oat which classes and methods are crucial to optimize during installation. If you unzip an APK, you will find an assets/dexopt/baseline.prof binary file which contains this information.
Tip: Decompiling Baseline Profiles
You can decompile and read the baseline.prof binary file using the Android SDK's profgen tool:
The output will be a list of class descriptors and methods:
(Note: the flags at the beginning indicate execution states: H = Hot, S = Startup, P = Post-startup)
If oatdump confirms your slow method is not being optimized, you can manually force AOT compilation by patching the Baseline Profile to test if it resolves the issue:
1. Decompile the app with Apktool: apktool d app.apk -o decompiled_app
2. Decompile the baseline.prof file using profgen (as shown in the tip above).
3. Modify the resulting text file by adding your slow methods.
4. Recompile it back into a binary:
5. Replace the original .prof and .profm files inside the decompiled_app/assets/dexopt/ directory.
6. Recompile the APK: apktool b decompiled_app -o app-patched.apk
You can now reinstall and measure the app startup time again.
What if you patch the baseline profile, confirm the method is compiled via oatdump, but the problem still isn't solved?
At this point, we have to dig deeper. Because the code is now running as native machine code, we can use simpleperf to analyze the raw CPU cycles and see exactly where the compiled code is spending its time.
This time, we use a command to record CPU cycles system-wide for 10 seconds:
We can then filter the output specifically for our package. We can generate an ordered list of executed functions and the percentage of time they consumed:
Also, we can build a call graph to see the execution paths leading to those functions:
This may show a lot of information, and although you might not be able to make sense of all of it, it can give clues as to what is happening. We'll show how this is used in the following example.
Example: The cost of JNI boundary crossings
We once reached this exact point in an investigation. We had patched the Baseline Profiles, but the app was still slow. Only after looking at the simpleperf symbol trace and call graph did we solve the puzzle.
The sorted trace already revealed a suspicious trend:
Namely, OS-level clock and ART lock functions were dominating the execution time, alongside MterpFieldAccessSlow. Our code didn't seem to heavily rely on these, making this very suspicious. We then checked the call graph to trace the path to these functions, which looked as follows:
The graph showed that our compiled code was constantly forcing slow field accesses (mterp_op_sget), which require expensive locks (MonitorEnter), and this solved our puzzle:
everything profile resolved the issue during initial triage: it forced both classes to compile to native code, removing the interpreter boundary entirely!Debugging performance issues when manipulating bytecode is a unique challenge, as even small changes can often lead to surprising runtime behaviors. As shown in the examples above, finding the root cause of a slowdown requires digging deep into the app, and relying on multiple, lesser-known tools. This requires a deliberate investment of time and engineering effort.
Because we know that applying advanced obfuscation and optimization requires careful consideration of the performance impact, we keep track of performance during automated testing and diligently investigate issues before they reach our customers. This allows us to build solutions that work for any app, and all devices.
When capturing a profiling trace for an obfuscated APK, you can use your ProGuard/R8 mapping.txt file to translate the obfuscated names back into their original using the following Python script:
deobfuscate_trace.py.The script:
